Introduction to the circulatory system
What is interstitial fluid?
Interactive animation of the Cardiac Cycle and how the pressure graphs and electrocardio grams match up.
An animation describing the changes the heart goes through in one cardiac cycle.
Oxygen carriage Dissociation curves.
Oxygen
carriage
Oxygen does
dissolve in plasma but the solubility is low and decreases further if the
temperature increases. The amount that could be carried by the plasma therefore
would be completely insufficient to supply all cells.
There is a protein in the
blood however that will carry 4 molecules of oxygen. The protein is called
haemoglobin (Hb) and is made up of 4 polypeptide chains, each with a haem
group. Each haem group can pick up 1 molecule of O2.

What is
The Partial Pressure of Oxygen?
During this topic you will come across the term of partial
pressure of oxygen. It does not mean the pressure of the blood itself.
Essentially it is a measure of the concentration of oxygen. It is written in shorthand
as pO2 and is measured in kilopascals (kPa).
Inhaled air in the alveoli has a pO2 =
14kPa. The pO2 of resting tissue = 5.3kPa
(lower pO2 = lower O2
concentration due to respiration) and the pO2 of active
tissues = 2.7kPa.
In either case, blood arriving at the
lungs has a lower pO2 than that in the lungs.
There is therefore a diffusion
gradient and oxygen will move from the alveoli into the blood. The O2 is
then loaded onto the Hb until the blood is about 96% saturated with oxygen. The
Hb is now called oxyhaemoglobin (HbO2).
Hb + 4O2 → HbO8

The blood is then taken to tissues
where the cells are respiring all the time, using oxygen.
The pO2 in the cells
of the respiring tissue will be low. As the red blood cell enters this region,
the Hb (with it’s high concentration of Oxygen) will start to unload the O2,
which will diffuse into the tissues and be used for further respiration.
As the blood passes through the tissues, since
much of the Hb will have already unloaded the O2, a much lower
percentage of the blood will be saturated with O2 as the blood
leaves the tissues. But this Hb still needs to release O2 in this
area so this tissue does
not miss out on oxygen.

A graph of the percentage saturation
of blood with O2, i.e. the amount of HbO2 as opposed
to Hb at different pO2 is shown below. It is called an oxygen
dissociation curve:
Put simply, we can see that if blood is in an
area of high partial pressure of Oxygen, there will be more Oxygen in the
blood.
A short video describing this

A short video describing this
A longer video describing this.
Why is the dissociation curve
an S shape??
It is S-shaped because of the behaviour of
the Hb in different pO2. Basically, haemoglobin has difficulty
picking up the first oxygen molecule. The partial pressure of oxygen is higher
than expected when the blood is 20% saturated. Once one Oxygen molecule has
been picked up, it becomes easier for the Hb to pick up oxygen so the next 3 O2
molecules are picked up at lower partial pressures than you’d expect.
The first molecule of O2 combines
with an Hb and slightly distorts it. The joining of the first is quite slow
(the flatter part of the graph at the beginning) but after the Hb has changed
shape a little, it becomes easier and easier for the second and third O2 to
join. This is shown by the curve becoming steeper. It flattens off at the top
because joining the fourth O2 is more difficult.

Overall, it shows that at the higher and lower end of the partial pressures, there isn't a great deal of change in the saturation of the Hb, but in the middle range, a small change in the pO2 can result in a large change in the percentage saturation of the blood.
Why are they called dissociation
curves?
If we think about these curves in a converse way, rather
than thinking about Hb picking up oxygen, we can think of it dropping off
Oxygen.
Ie If Haemoglobin was in a tissue with a partial pressure of
oxygen of 4Kpa, then we can see that if that Hb had been fully saturated (100%)
when it left the heart, it is now only 50% saturated, so it has ‘let go’ of 50%
of it’s oxygen and the oxygen has gone into the tissues. These graphs show us
the partial pressures of oxygen needed in tissues in order for them to be low
enough for the Hb to release Oxygen.
Foetal Haemoglobin and Myoglobin curves.


Foetal Hb needs to have a higher affinity for oxygen when it is at the same partial pressure as the mothers (adult) Hb.
Foetal Haemoglobin and Myoglobin curves.
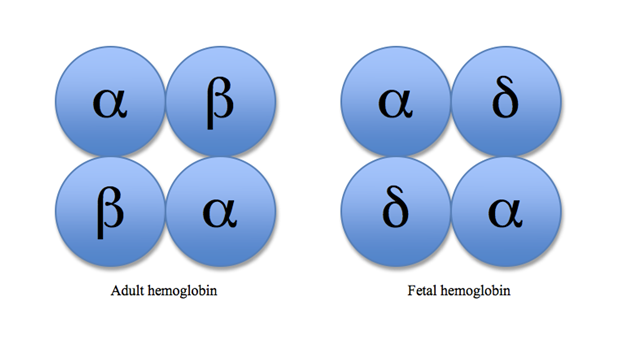
Foetal Haemoglobin
A oxygen curve that is further to the left of a normal oxygen dissociation curve shows that at the same ppO2, the curve to the left has a higher affinity for oxygen.
Here we can see that at 6 ppO2, Foetal Hb has a higher affinity for oxygen than the adult hb.

Foetal has two different chains to
adult haemoglobin. This difference allows foetal
haemoglobin to combine more readily than adult haemoglobin.

The foetus is able to gain
oxygen from the blood of the mother.
No comments:
Post a Comment